Visualization
Topic modeling is an unsupervised machine learning method that learns the underlying themes in a large collection of otherwise unorganized documents. This discovered structure summarizes and organizes the documents. However, topic models are high-level statistical tools—a user must scrutinize numerical distributions to understand and explore their results. So, we implemented a module visualization to reveal meaningful patterns in a collection, and helping end-users explore and understand its contents in new ways
You can read more detail about the methodology in [1]
To use this module, make sure that the packages pandas, Tkinter are installed in your system
tmlib.visualization.visualize(model, database_path, data_path, vocab_file)
This function will visualize the topics, some documents in a GUI App. And this function takes 4 arguments :
model: string or object class
LdaModelThis argument can take 2 values: string if it’s a path of file and object of class
LdaModelyou get after learning phase. If it is a path of file, this file is a file saving objectLdaModeldatabase_path: string,
This argument is path of file which stores topic proportions (\(\theta\)) of documents. You need to save topic proportions in learning phase. Note: this file should be a file
.h5and it is a database not only stores topic proportion but also stores content of documentsdata_path: string,
Path of file training data (corpus), you need the content of documents to visualize it
vocab_file: string,
File vocabulary of training corpus
Example
We’ll demo with AP corpus. First, you need to learn model from this corpus using Online-OPE. Because you have to save topic proportions - this takes a long time. So, we need a fast learning algorithm
from tmlib.lda import OnlineOPE
from tmlib.datasets import DataSet

data = DataSet(data_path='data/ap_train_raw.txt', batch_size=100, passes=5, shuffle_every=2)
onl_ope = OnlineOPE(data=data, num_topics=20, alpha=0.2)
# learn model and save topic proportions in file database 'database.h5'
model = streaming_ope.learn_model(save_topic_proportions='database.h5')
# save object model into file 'object_model.h5'
model.save('object_model.h5')
After learning, file vocabulary extracted will be saved into ~/tmlib_data/ap_train_raw/vocab.txt (you can see by run print data.vocab_file). Now, we can visualize the result
import os
from tmlib.visualization import visualize

# get the vocabulary file
vocab_file = os.path.expanduser('~/tmlib_data/ap_train_raw/vocab.txt')
visualize('object_model.h5', 'database.h5', 'ap_train_raw.txt', vocab_file)
And this is the result you achieve
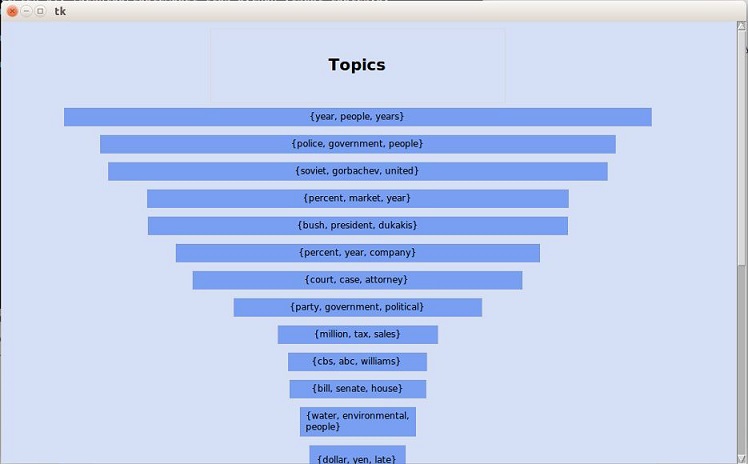
After you click on topic {years, people, years}
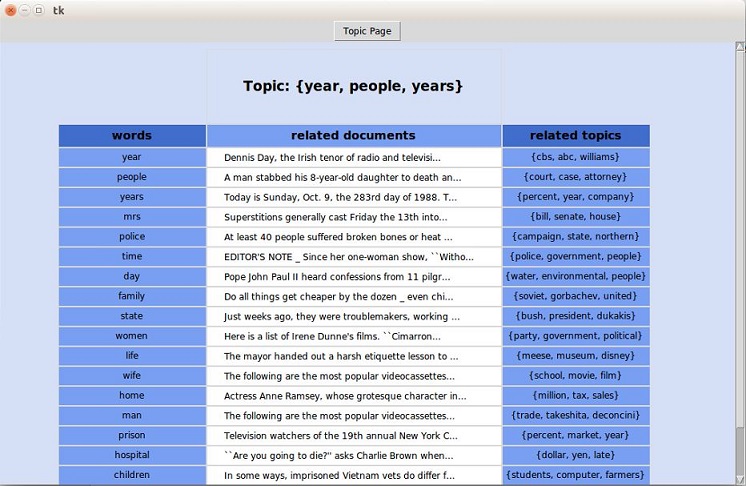
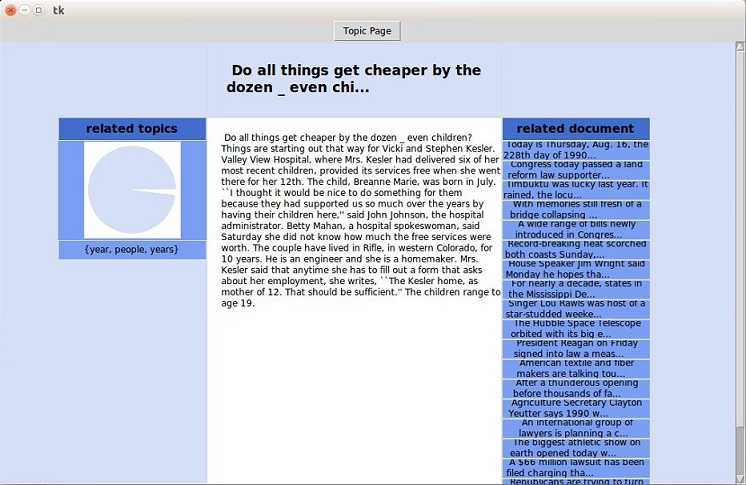
Click on the document with short content ‘Do all things get cheaper by dozen_even…’
| [1] | Visualizing Topic Models. Allison J.B. Chaney and David M. Blei. Department of Computer Science. Princeton University, Princeton, NJ USA. |